Showing posts with label Weather. Show all posts

Friday, August 2, 2013

A Year of Sky on Earth


From APOD:
 
"Explanation: Each panel shows one day. With 360 movie panels, the sky over (almost) an entire year is shown in time lapse format as recorded by a video camera on the roof of the Exploratorium museum in San Francisco, California. The camera recorded an image every 10 seconds from before sunrise to after sunset and from mid-2009 to mid-2010. A time stamp showing the local time of day is provided on the lower right. The videos are arranged chronologically, with July 28 shown on the upper left, and January 1 located about about half way down. Although every day lasts 24 hours, daylight lasts longest in the northern hemisphere in June and the surrounding summer months, a fact which can be seen here as the bottom (and soon top) videos are the first to light up with dawn. The initial darkness in the middle depicts the delayed dawn and fewer daylight hours of winter. In the videos, darkness indicates night, blue depicts clear day, while gray portrays pervasive daytime cloud cover. Many videos show complex patterns of clouds moving across the camera's wide field as that day progresses. As the videos collectively end, sunset and then darkness descend first on the winter days just above the middle, and last on the mid-summer near the bottom."

Sunday, July 21, 2013

30th Anniversary of the Lowest Recorded Temperature in the World

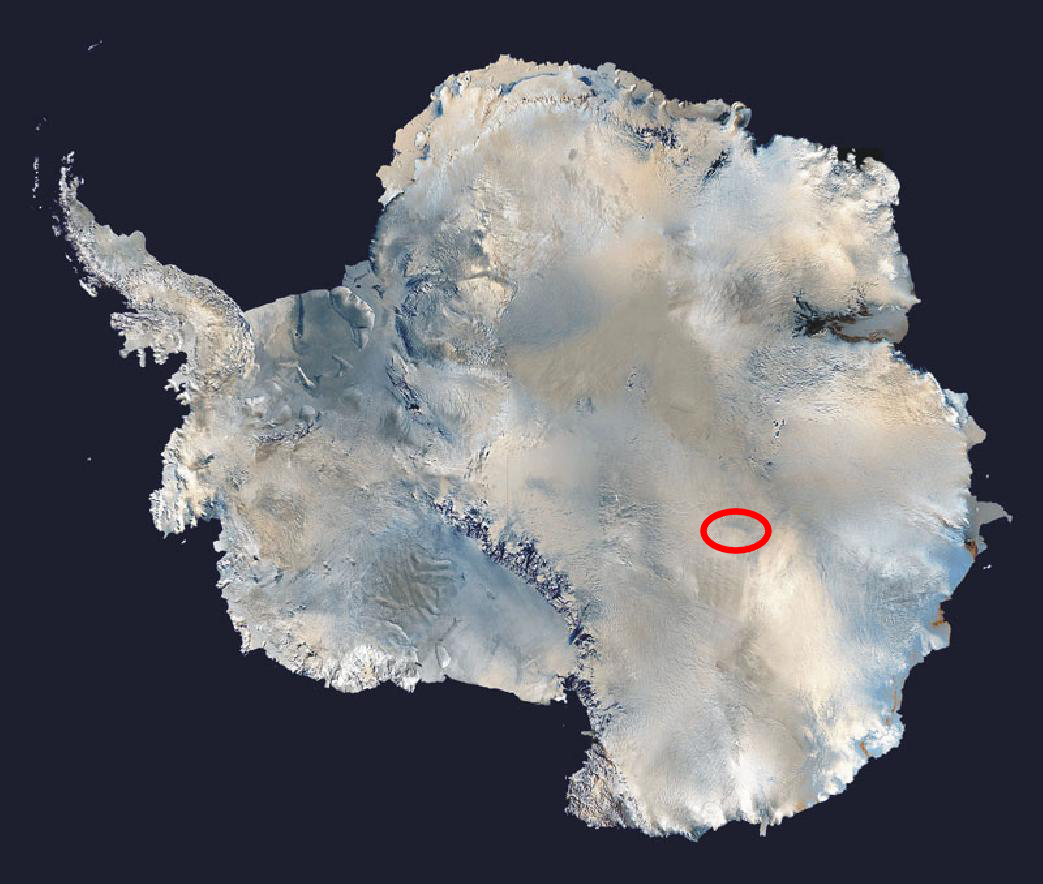
Vostok Station Antartica
Location of Lake Vostok in Antarctica. Original a composite satellite photo by NASA (public domain via Wikipedia)
This was recorded at the Vostok Station in the  Antarctic on July 21, 1983 when it was winter in the southern hemisphere. According to NOAA's National Climate Data Center, this is the most reliably documented occurrence of the lowest temperature in the world. Kind of refreshing to think about during the current summer heat wave in the northern hemisphere!

Thursday, June 20, 2013

NWS Radar Mosaic

Enhanced Radar Image Loop
 Above is the embedded National Weather Service Enhanced Radar Image Loop. For the clearer, highly detailed, full resolution National Mosaic image, see the NWS page. It's an amazing composite of the entire country's weather in very high resolution. It's well worth checking out!

Friday, May 24, 2013

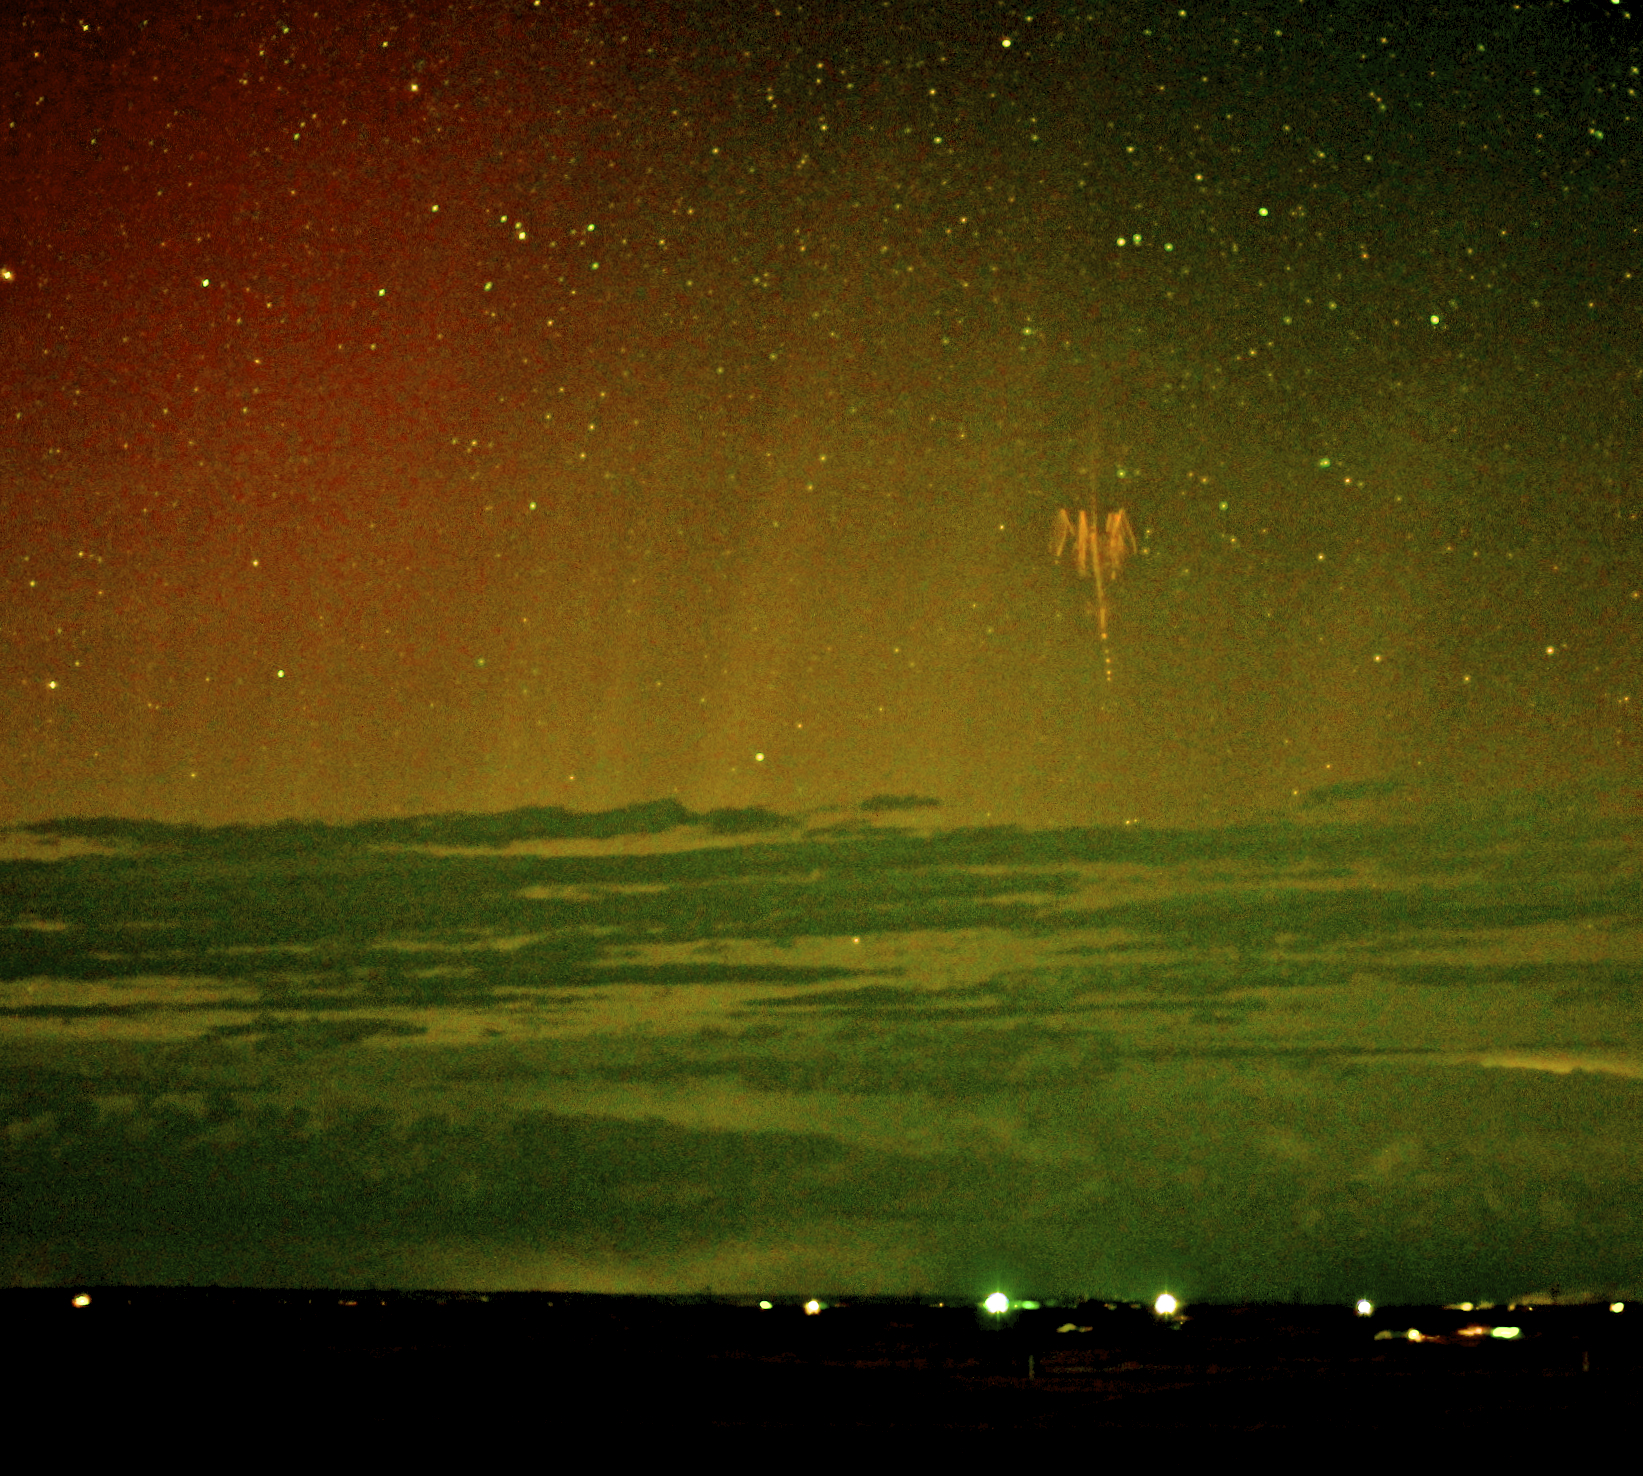
APOD - Red Sprite Lightning

Red Sprite Lightning with Aurora
Image Credit & Copyright:
Walter Lyons (FMA Research), WeatherVideoHD.TV
From APOD: "What's that in the sky? It is a rarely seen form of lightning confirmed only about 25 years ago: a red sprite. Recent research has shown that following a powerful positive cloud-to-ground lightning strike, red sprites may start as 100-meter balls of ionized air that shoot down from about 80-km high at 10 percent the speed of light and are quickly followed by a group of upward streaking ionized balls. The above image, taken a few days ago above central South Dakota, USA, captured a bright red sprite, and is a candidate for the first color image ever recorded of a sprite and aurora together. Distant storm clouds cross the bottom of the image, while streaks of colorful aurora are visible in the background. Red sprites take only a fraction of a second to occur and are best seen when powerful thunderstorms are visible from the side."

Tuesday, March 12, 2013

In Weather Forecasting, the European Model Rocks

Snowquester
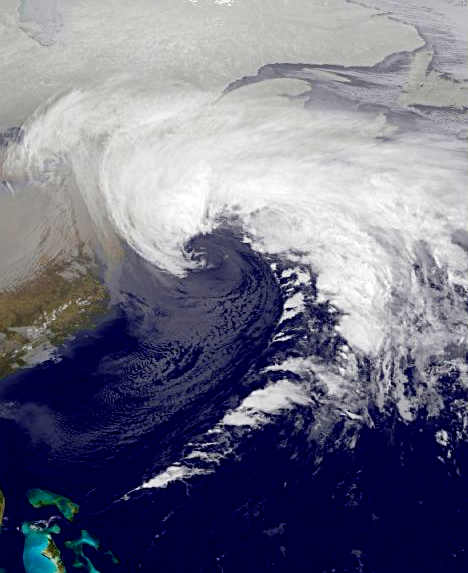
Snowquester - Image from NOAA's GOES-13 satellite on Mar. 6, 2013, shows winter storm over the U.S. mid-Atlantic.
As a semi-weather geek, I'm always fascinated by the accuracy of weather forecasting in our time. And some weather services are more accurate than others. Our own National Weather Service needs more support to be able to compete with the Europeans in forecasting. The European weather computer model, European Centre for Medium-Range Weather Forecasts (ECMWF), famously predicted exactly where Hurricane Sandy would fall, and more recently, the snowfall for Snowquester (March 6, 2013 Nor'easter). The Global Forecasting System (GFS) is run by the NWS every four hours and is the only model whose output is in the public domain freely available everywhere per U.S. law. But, many observers feel that the NWS is in need of increased computer power* to be able to produce the high quality forecasts for which the Europeans are renowned. The recent Snowquester forecast was a bit of an embarrassment for the NWS, unfortunately. But, we can do better and hopefully, their resources can be improved. Of course, watching the satellite views (above) of the impending Snowquester would have made many of us believe it was going to be huge everywhere in the Mid-Atlantic as opposed to mainly in the Shenandoah Valley!
 
Two recent interesting articles discuss the differences in numerical weather prediction: 
  1. The Washington Post cites a blogger who derides U.S. forecasting as "second rate."
  2. *National Geographic investigates the reasons the Europeans are stronger in weather forecasting.

Saturday, February 9, 2013

Blizzard Nemo

Feb 2013 New England Storm
The name refers not to the Clownfish, but the very tough Captain Nemo, who fought storms in Jules Verne's 20,000 Leagues Under the Sea. It's interesting that the National Weather Service disavows any naming schemes for winter storms, which is primarily promoted by the media. But Nemo brings back memories of Snowmageddon - referred to as the 2010 North American blizzard by the NWS - which pounded the Mid-Atlantic just three years ago. Those memories are still fresh so we in the Mid-Atlantic states deeply sympathize with New Englanders currently dealing with Nemo.


(Left) Satellite image of the February 2013 Nor'easter - image by GOES, NASA

Tuesday, February 5, 2013

Today is National Weatherperson's Day!

John Jeffries flew across the English Channel NOAA
John Jeffries flew across
the English Channel - NOAA
Traditionally, weather forecasters have gotten a bad rap for less than accurate predictions, but today that reputation is completely unjustified. Technology has improved forecasting to such an extent that weather people predict almost to the minute when the first snowflake will fall for a snowstorm! Computer models show storm tracks using spaghetti plots which aid forecasters with possible weather events. Long range forecasting is still difficult (witness the inaccuracies found in the Farmer's Almanacs), but day-to-day and even weekly predictions are very reliable. Feb. 5 has been designated National Weatherperson's Day in honor of John Jeffries (American, Feb. 5, 1744 - Sep. 16,1819) who was among the very first people to keep daily weather records. He also conducted the first weather balloon observation over London in 1784. He took weather instruments to an altitude of 9,000 feet and recorded temperature and barometric pressure during the flight. Some people may find weather boring and only worthwhile as the subject of small talk, but for me, it can be a fulfilling pastime, especially as it can impact our lives quite dramatically. In particular, if one lives anywhere along the eastern seaboard, which sees more than its fair share of wild weather! And in honor of National Weatherperson's Day, I want to express my appreciation to one of our local weather persons, Sue Palka, who not only provides accurate weather information, but does so in a calm and reassuring manner. She provides the information without the hype, which is the way news should be delivered. Thanks, Sue!

Sue Palka, WTTG Weather Person

Saturday, February 2, 2013

Ground Hog Day 2013

Snow lovers will lament; spring lovers rejoice. Apparently, Punxsutawney Phil did not see his shadow today so we'll hold him to his prediction that spring is near! Though, we're still waiting word from his taxidermied relative, Potomac Phil, who should make a stoic appearance in Dupont Circle. And of course, there are a whole slew of other groundhog prognosticators that may have their own prediction. But it's undeniable that Punxsutawney Phil is the ultimate prognosticator among the Marmota monax crew.

Saturday, January 26, 2013

Frigid Arctic Air Encases Us in its Wintry Mantle

Ye gods! Talk about the Big Chill. As anyone who lives on the east coast or mid-west knows  all too well, we've had a run of bitterly cold sub-zero days the past week. All one can do is hunker down under multiple layers and wait for the Big Thaw. It's so cold, even the internet feels freezingly slow!  Watch the LiveScience video below to see the daily progress of the arctic air as it plunges a good chunk of the country under its wintry mantle.
 

Tuesday, October 30, 2012

Terrible Beauty

NASA’s Aqua satellite image of Hurricane Sandy
taken at 2:20 p.m. Eastern Daylight Time
(18:20 Universal Time) on October 29, 2012.
Such an innocuous sounding name - Sandy - such devastation for so many. It's almost over in weather terms, but the effects will linger for months. When I first heard the initial forecasts last week, like many others I had a hard time imagining what the scientists could mean when they said this would be unlike any other storm in recent history. Having experienced the full force of Snowmageddon, I wondered just how much worse any storm could be!  A perfect "Perfect Storm" that could only be produced by the confluence of certain conflicting events - a cold, Canadian front from the northwest colliding with a tropical hurricane from the southeast, further egged on by a full moon on October 29th, all of which wreaked havoc across the Mid-Atlantic coast. The news coverage of this storm, though initially sounding greatly hyped and overblown, turned out to be quite accurate and timely. With the help of NOAA scientists who correctly predicted its magnitude, the media encouraged residents to prepare for the storm and most people did that. Below are some interesting newslinks which illustrate the unique and dangerous qualities of Sandy, the largest Atlantic hurricane in diameter on record, whose winds spanned about 1,100 miles from end to end (National Hurricane Center).


1.  NYT interactive graphic of wind speeds along Hurricane Sandy’s path.
2.  NYT graphic of the spread of power failures across the Northeast.
4.  Hurricane Sandy social media rumors and other false rumors.
5.  Archived data on Hurricane Sandy from the National Hurricane Center.
6.  NASA graphic depicting Sandy's immense size.
7.  WP's Joel Achenbach puts the storm in perspective.
8.  Unbelievable before and after photos of Sandy's damage.
9.  Real and Fake photos generated by Sandy.
10. The Waffle House Index, a measure of the severity of disasters.
11. Amazing before and after satellite photos of New Jersey's shoreline.
12. Remarkable time-lapse footage of NYC lashed by Sandy; about half-way through, power goes out to Lower Manhattan.
13. AP's state by state account of the effects of Sandy from NC to VT.
14. And of course, Wikipedia's comprehensive article on Hurricane Sandy.

Monday, October 29, 2012

Amazing Time-Lapse Scan of Hurricane Sandy

 
This video really gives you a sense of how this powerful and immense storm is moving along the eastern coast of the US.  Additional videos can be viewed on NASA Earth Observatory's Youtube Channel.

Friday, October 26, 2012

Hurricane History

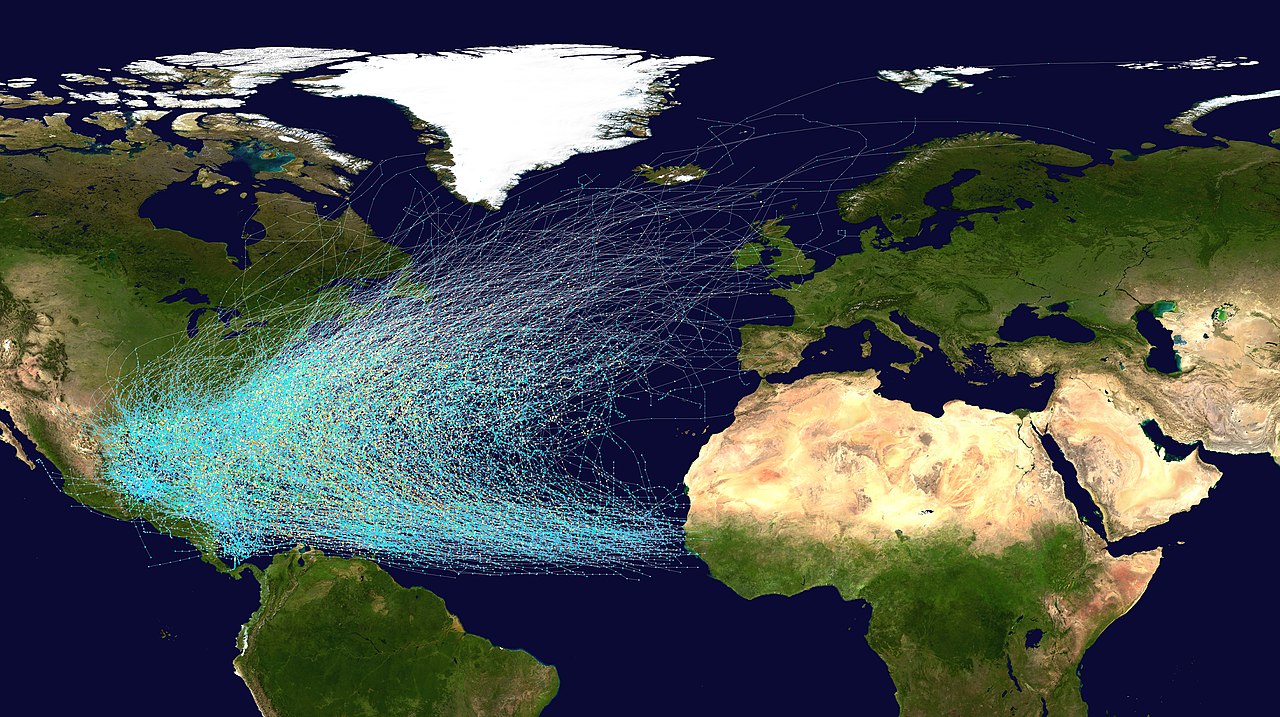
Image displays the tracks of all Atlantic hurricanes which formed between 1851 and 2005
The image above displays the tracks of all Atlantic hurricanes which formed between 1851 and 2005. The dots show
the locations of the storms at 6-hour intervals and uses the color scheme from the Saffir-Simpson Hurricane Scale.
 See the Wikimedia Commons image link for more details about the map.

With the East Coast bracing for Hurricane Sandy, or Frankenstorm as it's been dubbed already, I did a little research about the Atlantic hurricane season. I was curious about just how long the season lasts and found that generally it runs from June 1 through November 30, with September being the most active month. NOAA has compiled a list of all Atlantic hurricanes which occurred between 1851 and 2007, which confirms the seasonal nature of these storms. The National Hurricane Center website provides more interesting information and data archives on hurricanes, plus of course, the most up-to-date status of current storms. Well, here's hoping Sandy won't be the worst Halloween trick Mother Nature might play on us!